| tags: [ development python Jupyter SVG ] categories: [Development ]
Python SVG Deformation Basics
Deformation Basics
I’ve got a cool xy pen plotter AxiDraw v3 and I wanted to create some interesting drawings that showcased the fine detail possible with a really good pen Uniball Signo DX. The AxiDraw Plotter is driven by SVG plots, usually through Inkscape. Even though I can create some interesting SVG plots with Inkscape I thought that generating SVG files through Python might be an interesting opportunity to understand both SVG and Python a bit better. I chose to work with the drawSvg base library and see what I could accomplish by building my own library.
Here is an example if what I was able to create with this combination and I’m going to work through the process of creating the library that enabled me to create this.
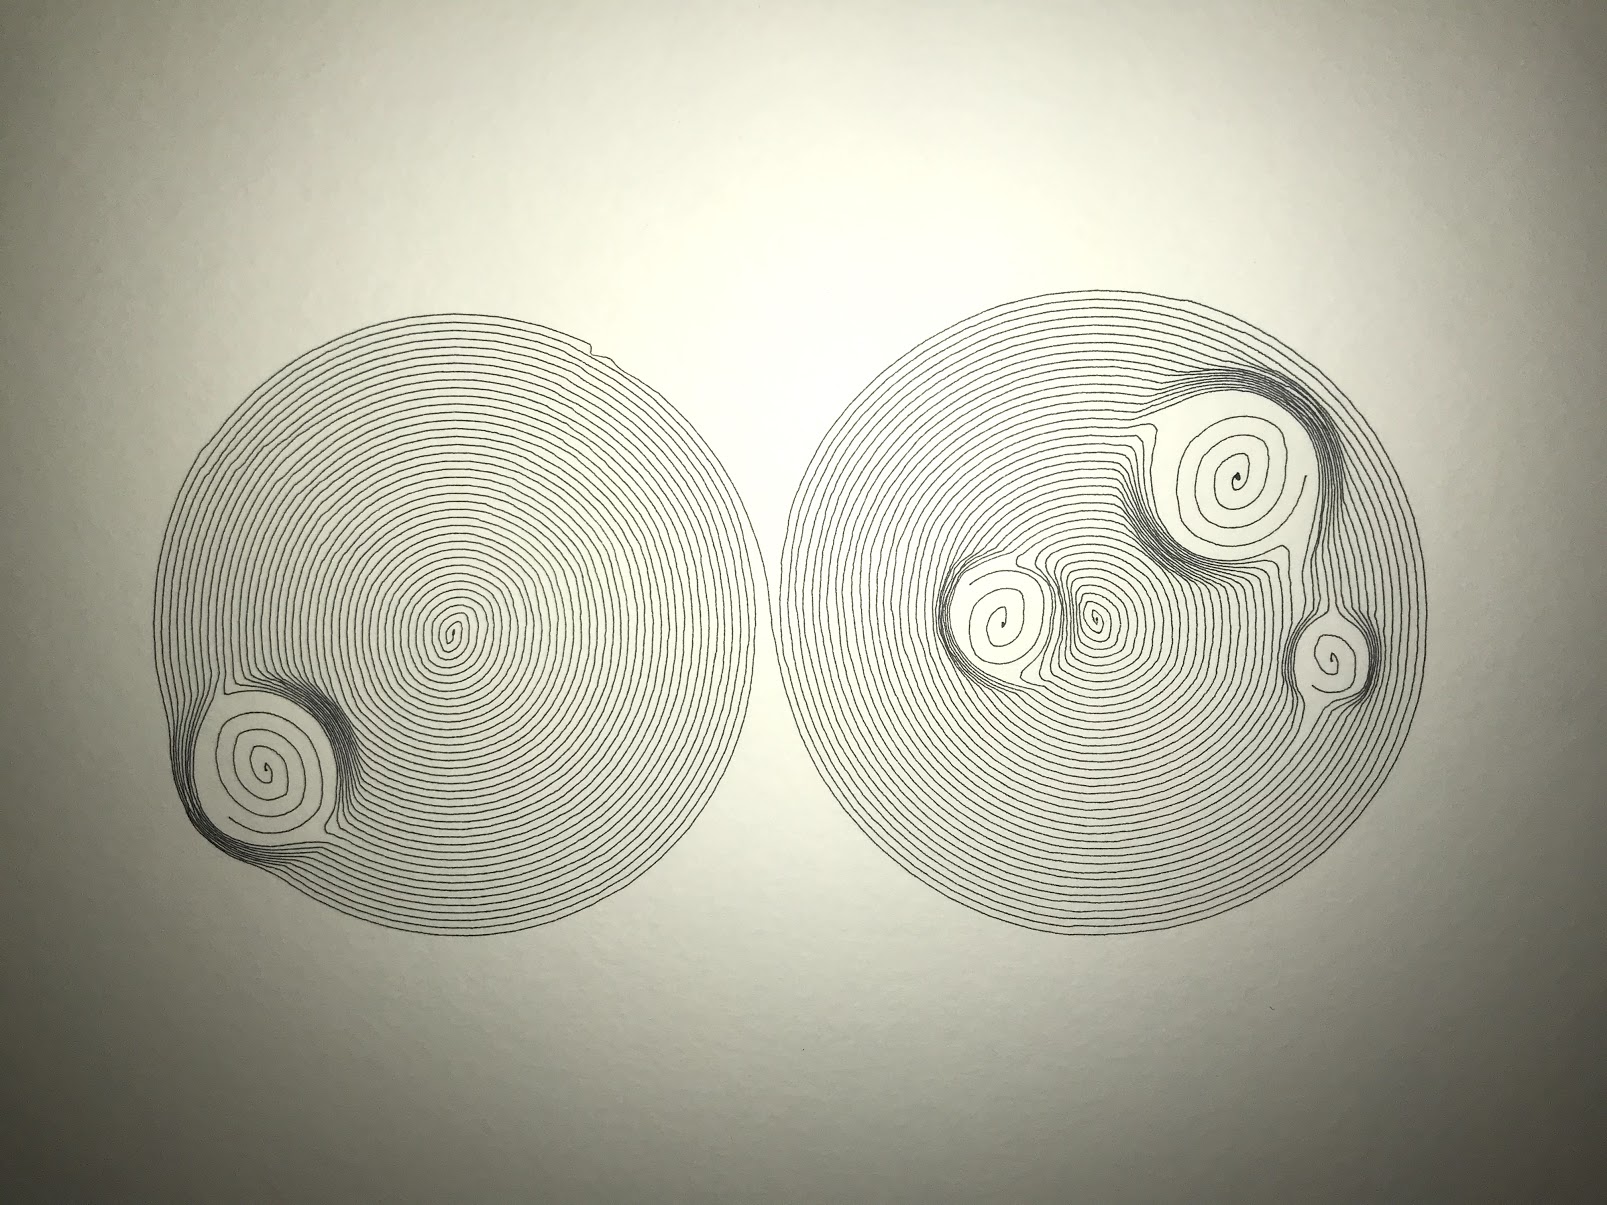
This initial post will go through an effect that I have been interested in creating. For lack of a better name, I’ll call it a ‘deformation’. If I have a region of dots, and pick a point within the field, then push all the dots out from that center by a some proportional amount. In the picture above, the inner spirals have been plotted within a deformation.
So the rest of this post describes how I worked through this problem to create an initial implementation of a deformation.
Initial Setup
First I need to include the drawSvg package as well as my my SVG Deform repository
import drawSvg as Draw
from SVGDrawArea.DrawArea import DrawArea
from SVGDrawArea.Point import Point
Next define the drawing area and provide a nice grid background for reference.
extent = Point(200,200)
da = DrawArea(*extent)
da.grid_background(opacity=0.1, hlinestep = 25, vlinestep=25, centerpoint=2, stroke='black')
da.get_drawing()

Since I will have a few cases where I want to clear the drawing area
and start with a clean slate, I’ll define a clean_slate() function to
make that happen.
def clean_slate():
    extent = Point(200,200)
    da = DrawArea(*extent)
    da.grid_background(opacity=0.1, hlinestep = 25, vlinestep=25, centerpoint=2, stroke='black')
    return da
Grid of dots
Now I will add a grid of green dots as a starting set of points to
peform the deformation operation on.
Note: range function includes start range, but does not include
end of range
so adding one step to end range results in inclusive points betwen 40
and 170.
Since I use this grid point generator a few times, I’ll put it in a function.
def point_grid():
    return (Point(x,y) for x in range(40,170,10) for y in range(40,170,10))
Then call the DrawArea points method with the point_grid to plot all the points.
da.points(point_grid(), r=2,fill='lightgreen',opacity=0.6)
da.get_drawing()

My deformation will be centered at the center of the draw area, and will have a radius of 50. I’m going to define that circle and present it in a light red.
deformCenter = Point(100,100)
deformRadius = 50
da.points([deformCenter], r = deformRadius, fill='red',fill_opacity=0.1 )
da.get_drawing()

The red circle is simply for reference on subsequent steps.
Points that will be moved
I need to identify the points that will be moved. This can be done with some trigonmetry and filter criteria. For each point in the field, determine if it is inside or outside the range of the deform circle. I could get close with a bounding box, but a bounding box would include points in the corners and I want to only move those points within the circle. I really want a bounding circle.
The calculation here is:
- for each point under consideration (piter)
- calculate distance between center point (deformCenter) and point under consideration (p)
- collect all points where distance(deformCenter,p) <= deformRadius
For example, the distance between deformCenter: Point(100,100) and the
Point(150,150) can be calculated by using the distance method on
point. This wraps math.hypot see Pythagroean Theorem
deformCenter.distance(Point(150,150))

70.71067811865476
sqrt(502 + 502)=70.71
I found that the filterfalse function from itertools worked nicely
for filtering out the points that were not inside the deform circle.
from itertools import filterfalse

boundedPoints = list(filterfalse(lambda p: deformCenter.distance(p) > deformRadius, point_grid()))
Note that I am converting the generator containing all the
boundedPoints into a list list() this peforms the generator
operation and saves a list of points to memory. Something that I have
been trying to avoid, but in this case, a want to reference the list a
few times so I decided it was worth it in this case. I could have
also used the itertools.tee function to create two independent
generators.
After filtering all the points that are within the range, I’ll plot these points back to the draw area with a blue fill.
da.points(boundedPoints, r = 1, fill='blue',fill_opacity=0.5 )
da.get_drawing()

Moving points
Now that I know which points to move, the next thing to think about is how far to move them? As a first attempt, I’ll just move all of them out to the radius of the deformation circle… Let’s see what that looks like. I’ll start with the saved list of boundedPoints that will be moved.
da = clean_slate()
da.points(boundedPoints, r = 1, fill='blue',fill_opacity=0.5 )
da.get_drawing()

For each boundedPoint, calculate the angle from the deform center to
the bounded point. I’m using a function I wrote called angleDistTo
which wraps math.atan2. A noteable consequence of calculating angle,
distance tuples is that the point location is not kept. When
converting back from an angle, radius to a point again, I have to
define the point from which the angle and distance will be calculated.
help(Point.angleDistTo)
Help on function angleDistTo in module SVGDrawArea.Point:

angleDistTo(self, other:~T) -> [<class 'float'>, <class 'float'>]
    Calculate the angle and distance from self to other.  Return as tuple (angle,dist)
angleDistance = (deformCenter.angleDistTo(p) for p in boundedPoints)
angleDistance will contain all tuples from boundedPoints
representing angle and distance from the deformCenter.
Then create a new point with the same angle with the distance set to deformRadius.
newPoints = (Point.fromAngleAbs(a,deformRadius) for a,_ in angleDistance)
da.points(newPoints, r = 2, fill='cyan',fill_opacity=0.5 )
da.get_drawing()

Not what you expected? When calculating angle and distance between two
points with angleDistTo, the result is relative to the origin point
(0,0) But we want the new points to be relative to the boundedCenter
In this case that is deformPoint. Here is the corrected code using
a Point method fromAngle.
angleDistance = (deformCenter.angleDistTo(p) for p in boundedPoints)
newPoints = (deformCenter.fromAngle(a,deformRadius) for a,_ in angleDistance)
da.points(newPoints, r = 2, fill='cyan',fill_opacity=0.5 )
da.get_drawing()

Push out to radius result
I’ll run the whole calculation pipline and show the final result.
Before deformation
da1 = clean_slate()
da1.points(point_grid(), r=2,fill='lightgreen',opacity=0.6)
da1.get_drawing()

After deformation
da2 = clean_slate()
newPoints = (p if deformCenter.distance(p) > deformRadius
             else deformCenter.fromAngle(deformCenter.angleDistTo(p)[0],deformRadius)
             for p in point_grid())
da2.points(newPoints, r=2,fill='lightgreen',opacity=0.6)
da2.get_drawing()

That looks like it accomplishes the goal, but I want to go one step further…
Proportonal Push Deformation
Just pusing all the points out to the deformation radius works, I wanted to try something a little more like a push out field. Here’s the same calculation, but rather than pushing everything out to the radius, the points are pushed out proportionally from the center to the edge. I like this effect a bit better.
def deformProportional(angle, radius, radiusMax):
    newRadius = (1 - radius/radiusMax) * 0.35 * radiusMax + radius
    return (angle, newRadius)
da3 = clean_slate()
newPoints = (p if deformCenter.distance(p) > deformRadius
             else deformCenter.fromAngle(*deformProportional(*deformCenter.angleDistTo(p),deformRadius))
             for p in point_grid())
da3.points(newPoints, r=2,fill='lightgreen',opacity=0.6)
da3.get_drawing()

More to come
This is just a starting point for other work that I’ll share in the next couple weeks.
Hope you enjoyed this thought experiment!
